

Traffic and bandwidth analytics
See a website's bandwidth consumption and visitor numbers over today, the last week or the last month.
Each website reports its own traffic. Open a website and select Analytics.
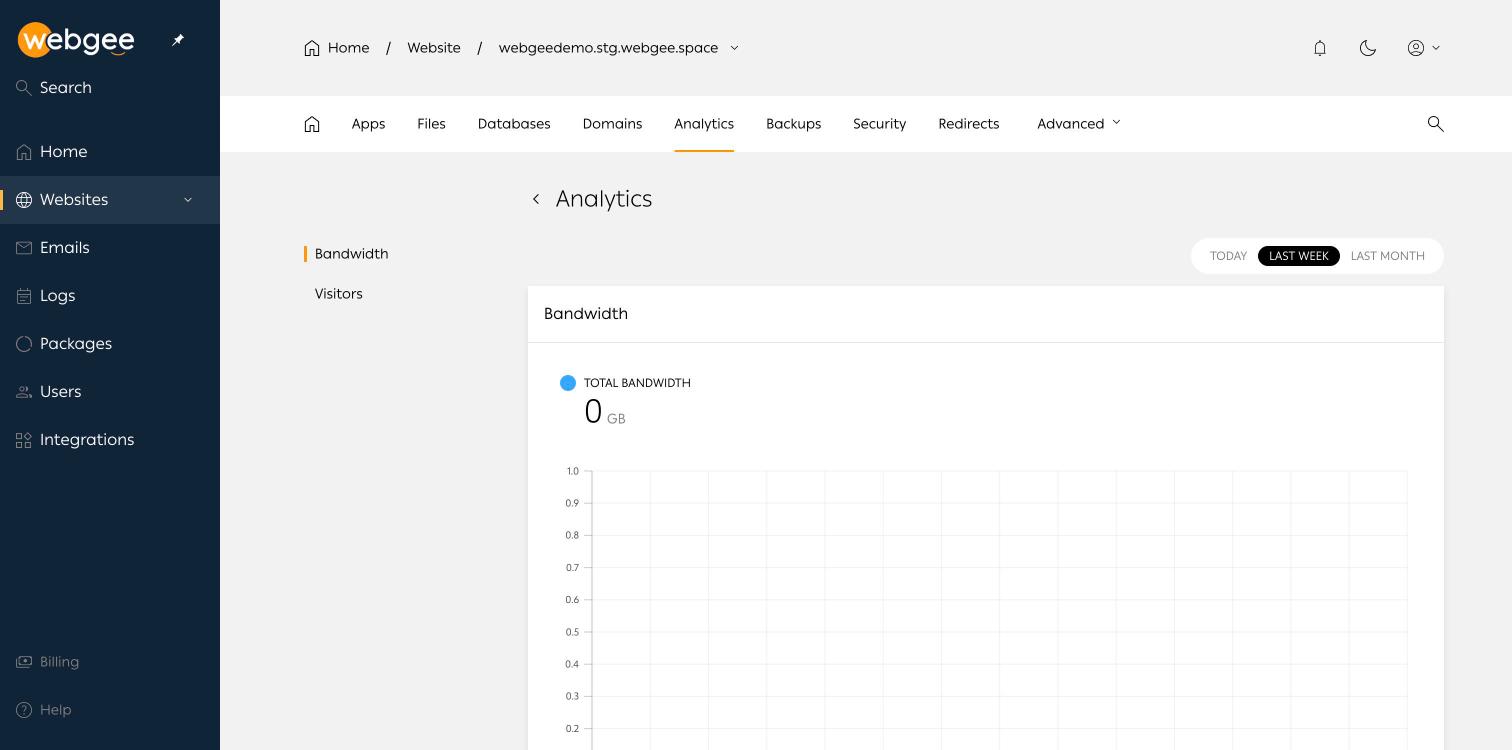
Two views, selectable in the left sidebar:
- Bandwidth — total data served, as a headline figure and a chart.
- Visitors — hits over the same period, split into total and unique.
The period selector top right offers TODAY, LAST WEEK and LAST MONTH.
The dashboard shows the same visitor data aggregated across every website in the organisation, and each website's overview page carries a Visitors chart with a See all analytics link through to here.
Reading it honestly
These are server-side hits, so they count bots, monitoring checks and asset requests alongside people. They are the right numbers for capacity questions — whether you are near your bandwidth allowance, or whether a traffic spike explains a slow site.
They are not the right numbers for marketing. Use analytics software in the site itself for that; it will report lower figures, and those will be closer to the number of actual humans.