

Email stats
Break your sending volume down by sender, recipient and IP address, to find what is generating traffic you did not expect.
Email Stats breaks volume down rather than summarising it. Applies to all plans that send through the outbound relay.
Choose a start and end date. The header shows the total for that range, and the page then breaks it down three ways — by IP address, by recipient (Volume by To Address), and by sender (Volume by From Address). Each breakdown is a top-10 chart followed by a full table with counts and percentages.
What each breakdown answers
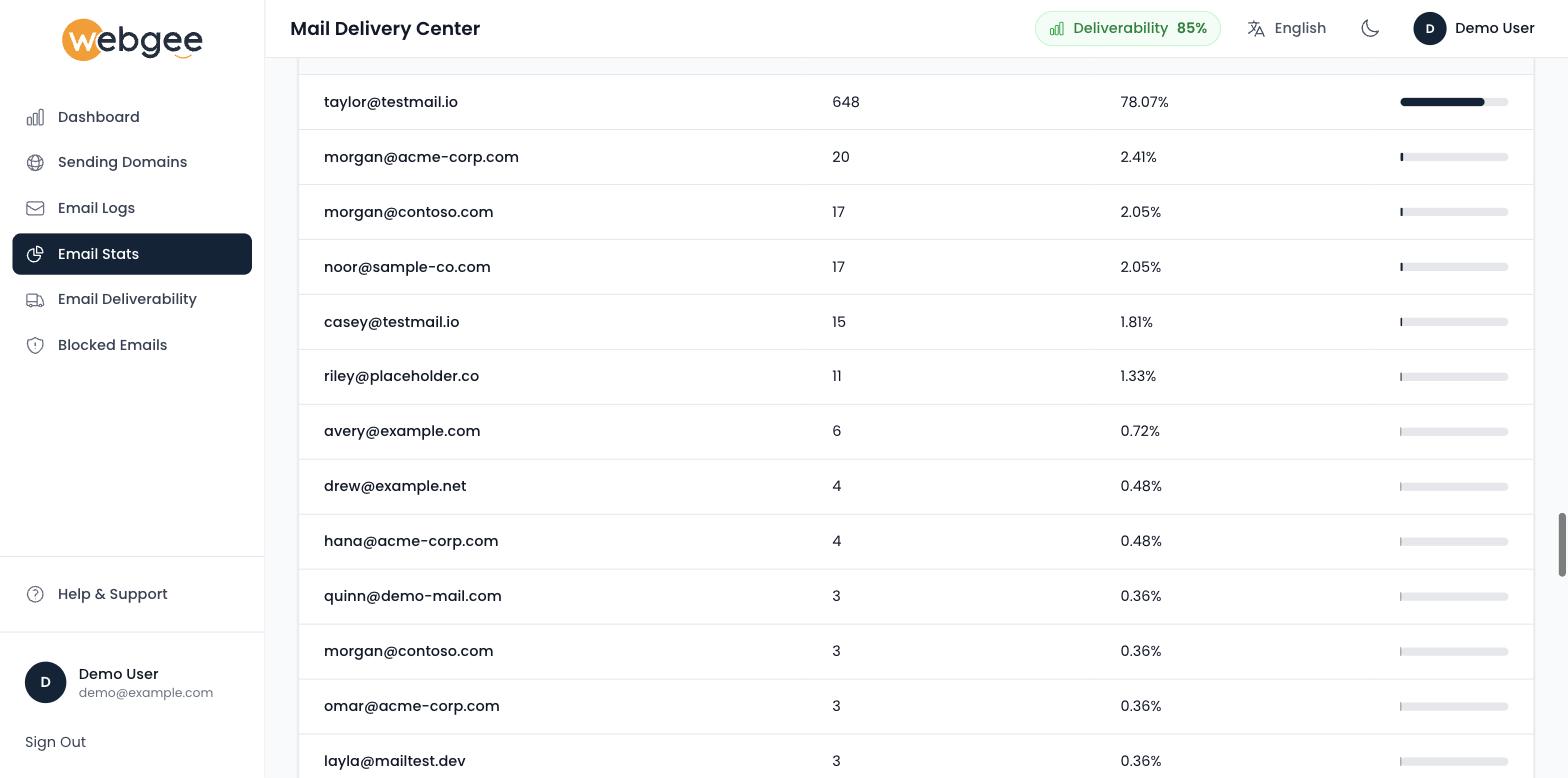
By sender — which mailbox or application is generating your traffic. This is the one to reach for first when volume is higher than expected, and it is how you find a compromised mailbox: an address you barely use sitting at the top of the list.
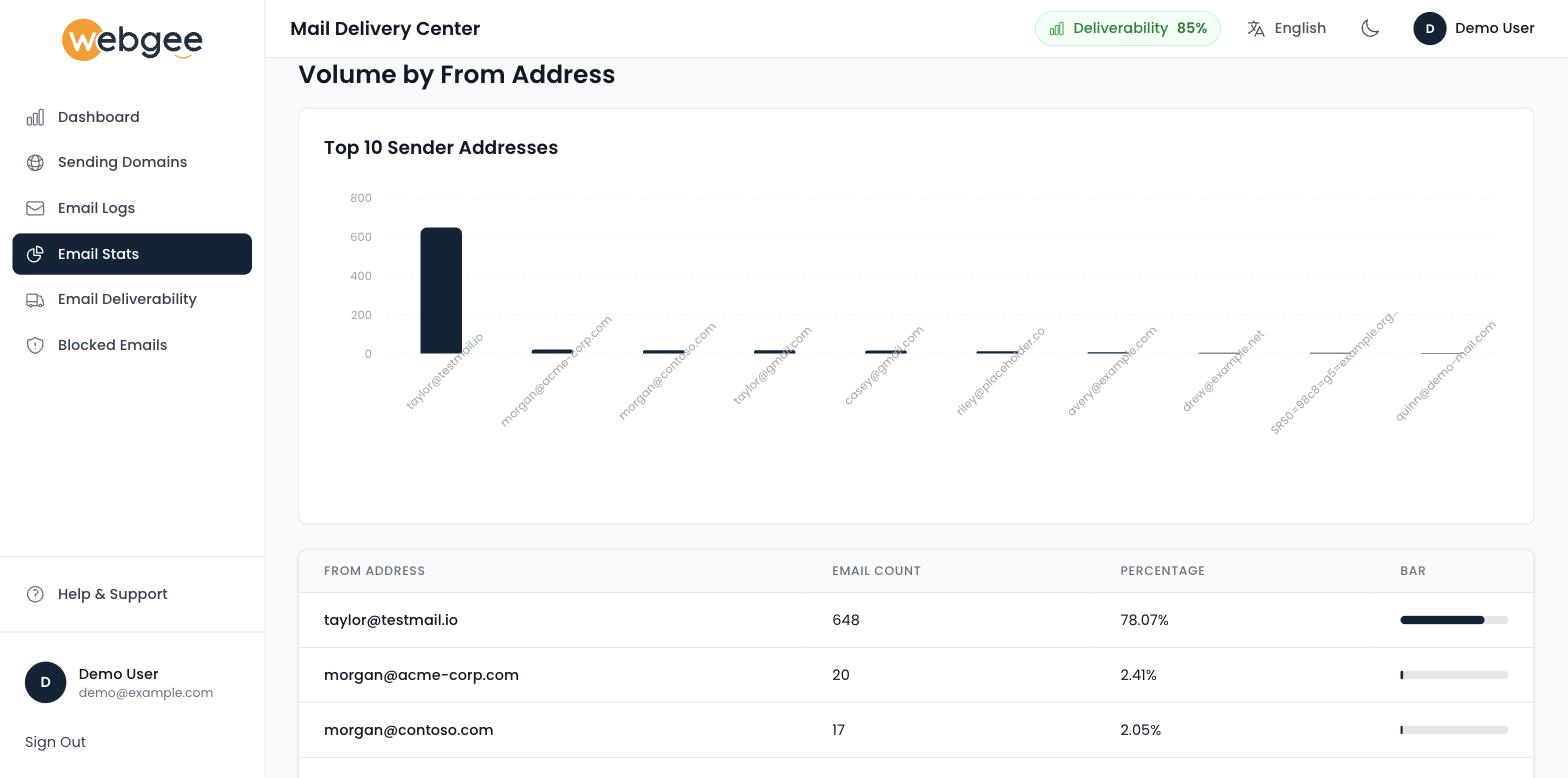
One address at 78% of everything sent is normal for an application relaying transactional mail, and a red flag for a human mailbox.
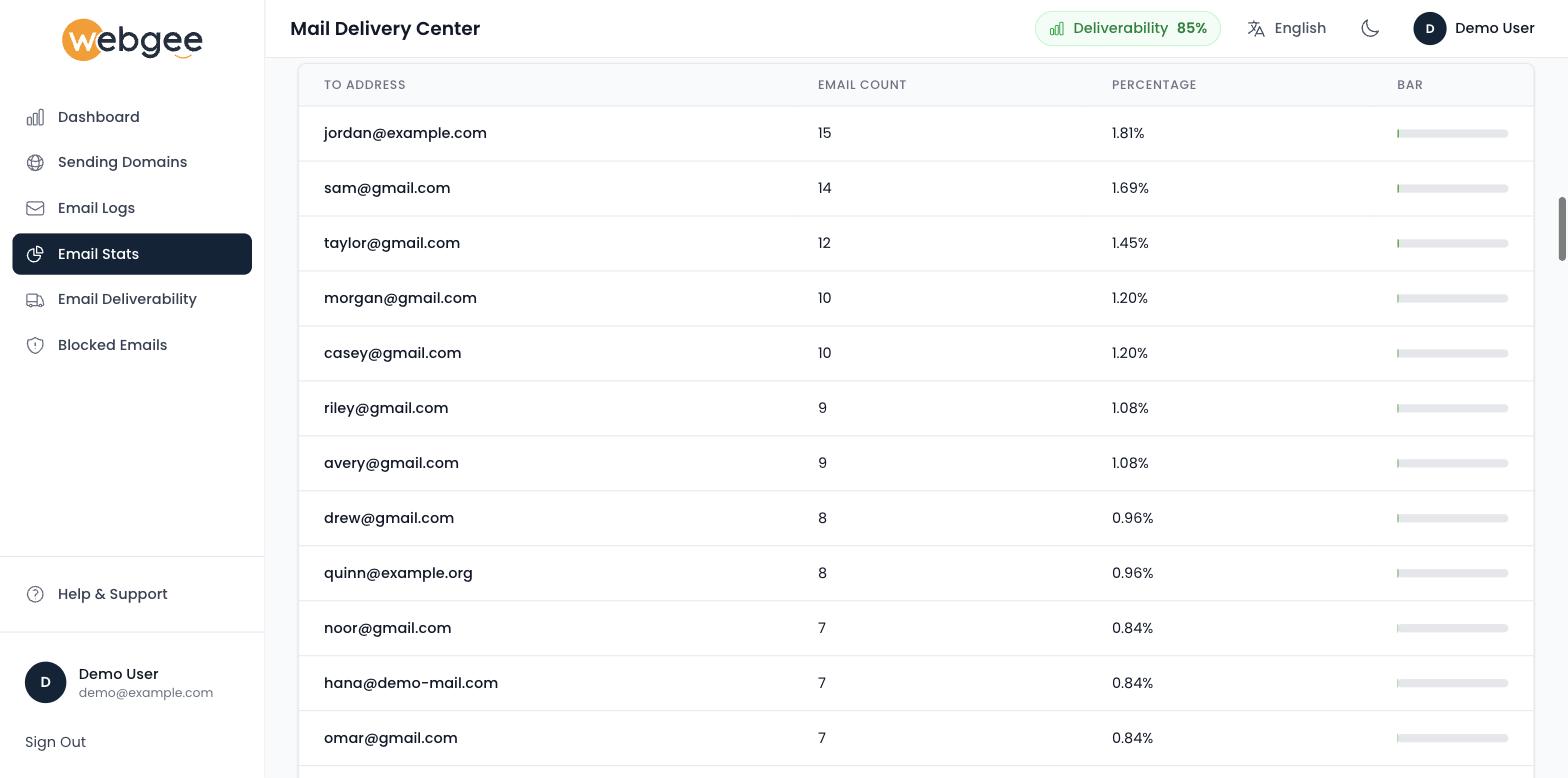
By recipient — who is receiving the most. A single recipient dominating usually means a loop, an application retrying, or a notification address subscribed to something noisy.
By IP address — which addresses your mail originated from. Useful on an account with several services, or when you expect all mail to come from one place and it does not.
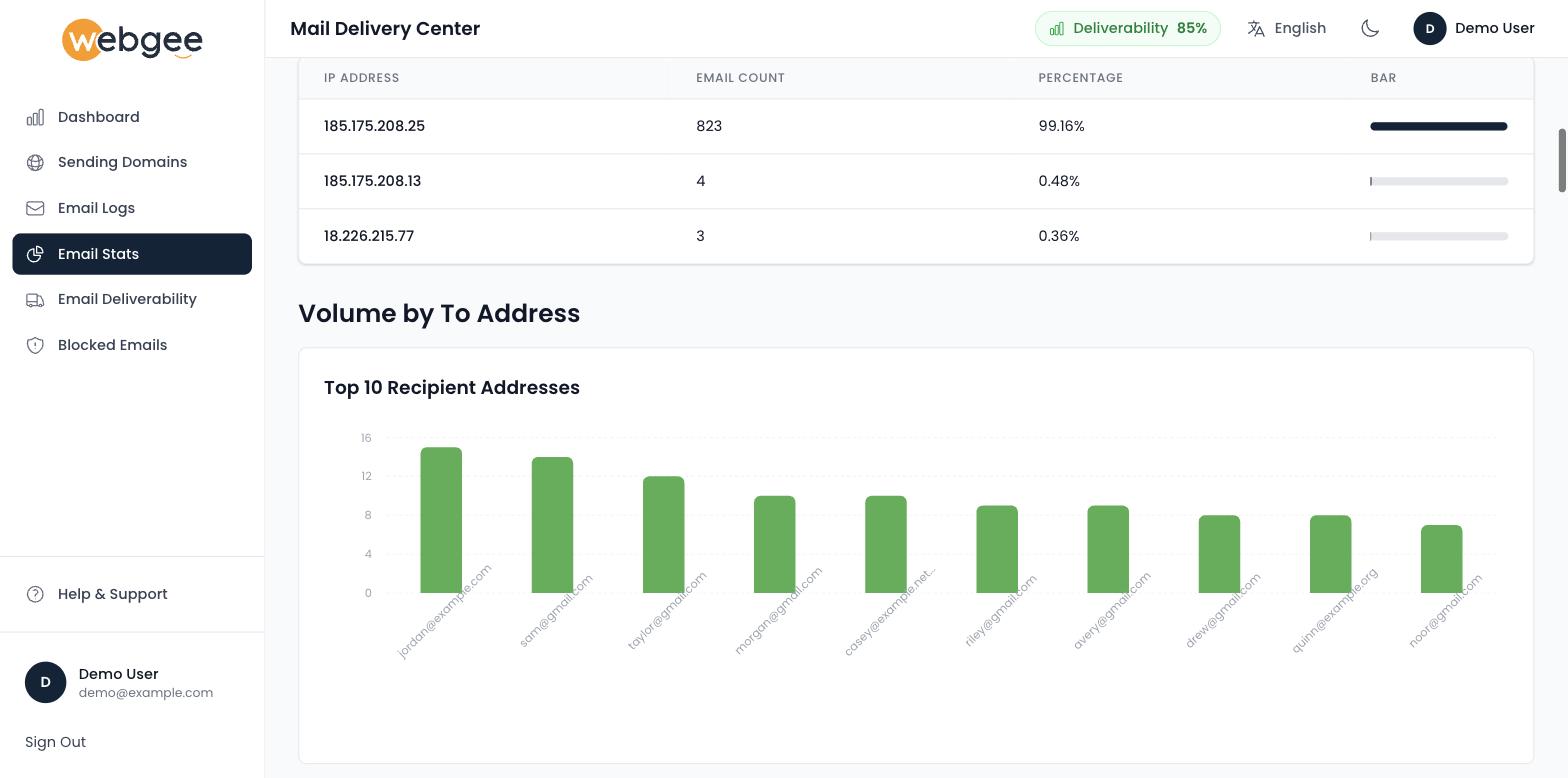
Almost all of your mail should leave from a single relay IP. A second address carrying meaningful volume means something is sending from somewhere you may not have accounted for.
Using it for capacity
Your sending is capped per domain per hour — see Email sending limits. If you are hitting the limit, this page tells you what to move rather than guessing.
Typically the answer is that transactional mail from one application accounts for most of the volume, and moving that application to its own SMTP relay frees the shared quota for everything else. See Why mail from your PHP script fails.
Using it for reporting
The breakdowns export a simple picture of who sends and receives most, which is enough for a monthly summary without adding an analytics product.
These are relay-side figures, so they count every message handed to the relay — including automated mail your users never see, such as password resets and order confirmations. That is the right number for capacity planning and the wrong one for judging how much people are emailing each other.
Related
Blocked emails
See which addresses are currently blocked, understand why a block exists, and release one when it was applied in error.
Premium Email
Business email on your own domain without a hosting account — mailboxes, aliases, DNS, migration and client setup, all managed from your WebGee client area.