

تنزيل سجلات الوصول الخام
احصل على سجل Apache غير المعالَج لموقعك، واضبط الأرشفة كي تبقى البيانات موجودة حين تحتاجها.
يمنحك Raw Access سجل وصول الخادم نفسه — كل طلب، بلا تلخيص. وهو ما تحتاجه حين لا تكون الرسوم البيانية في Visitors أو Awstats محدّدة بما يكفي. ينطبق على الاستضافة المشتركة والموزِّعة والمميّزة على cPanel.
افتح Raw Access في cPanel ضمن Metrics.
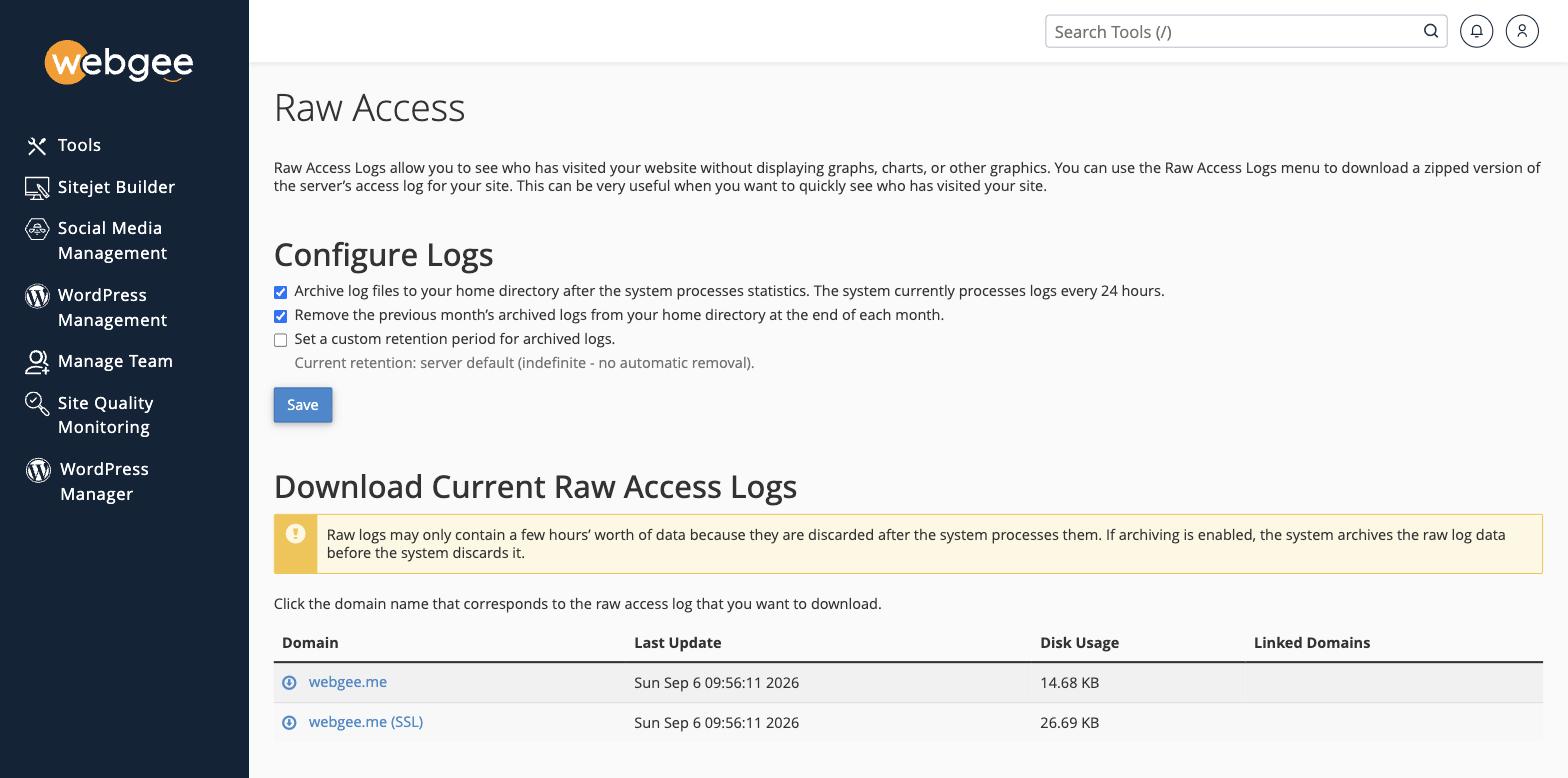
نزّل سجلًا
ضمن Download Current Raw Access Logs، اختر النطاق. وتُدرَج زيارات HTTP
وHTTPS منفصلةً — example.com وexample.com (SSL) — فنزّل الاثنين إن أردت
الصورة الكاملة.
والملف بصيغة Apache combined مضغوطًا بـ gzip: سطر لكل طلب، مع عنوان العميل والختم الزمني والمسار المطلوب ورمز الحالة والمُحيل ووكيل المستخدم.
قد لا تحمل السجلات الخام إلا بيانات بضع ساعات. فالنظام يعالجها إلى إحصاءات كل 24 ساعة ثم يتخلّص من البيانات الخام. فإن كنت تحقّق في شيء حدث أمس وكانت الأرشفة معطّلة، فالسجل قد ذهب أصلًا.
فعّل الأرشفة قبل أن تحتاجها
ضمن Configure Logs:
| الإعداد | الأثر |
|---|---|
| Archive log files to your home directory | يحفظ السجل الخام بعد المعالجة. فعّل هذا |
| Remove the previous month's archived logs | يحذف أرشيف الشهر الماضي كل شهر |
| Set a custom retention period | يحفظ الأرشيفات عددًا من الأيام تختاره |
والأرشفة هي الإعداد المهم. فبدونها لا يوجد ما تحقّق فيه بعد الواقعة.
وتقع السجلات المؤرشفة في logs/ في مجلدك الرئيسي وتُحسب على حصة قرصك. وعلى
موقع مزدحم تنمو سريعًا، ولهذا يوجد خيار الحذف الشهري — اتركه مفعَّلًا ما لم يكن
لديك سبب للاحتفاظ بأكثر، وراجع
مراقبة استخدام القرص.
اختر Save بعد تغيير أي شيء.
فيمَ تستخدمها
- معرفة ما يطرقه روبوت. صفِّ حسب وكيل المستخدم لترى إن كانت زيارات الزواحف تفسّر قفزة في الحمل.
- تأكيد وجود هجوم. فطلبات POST متكررة إلى
wp-login.phpمن عنوان واحد ظاهرة في السجل الخام وغير مرئية في رسم بياني للزوار. - فحص إعادة توجيه. فعمود رمز الحالة يعرض بالضبط ما أعاده الخادم.
وللزيارات الملخّصة بدلًا من ذلك، استخدم Visitors أو Bandwidth أو Awstats في قسم Metrics نفسه.